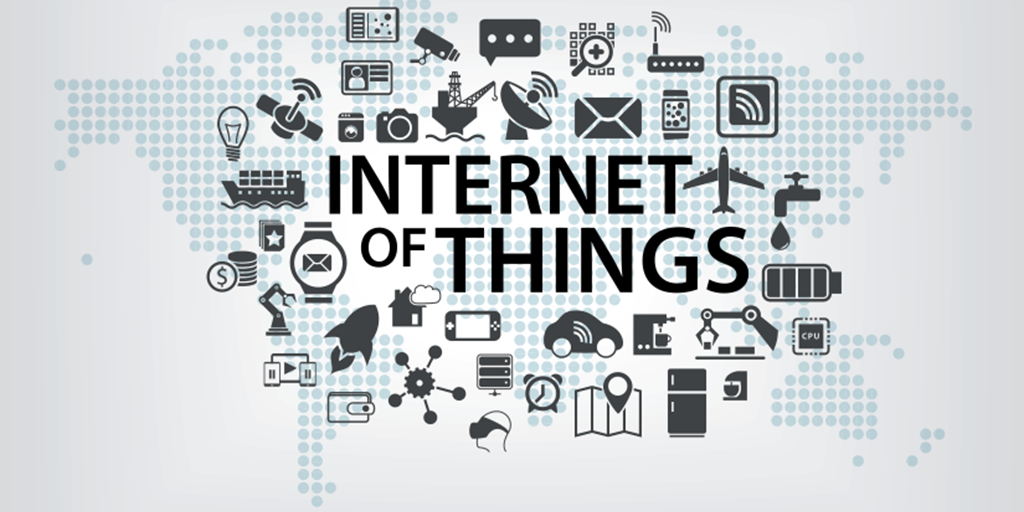
For the last couple of years, Scenario 77 has been working within several, primarily, manufacturing customers on their Internet of Things (IoT) implementations. Early projects were limited in scope but as the success of these projects have been born out we are now seeing a significant expansion as we roll into 2019. Everybody loves to guess what the next big trend will be but here’s what we are seeing “in the wild” with our customers. And if you need a little better explanation of what IoT is and can be, check this quick article out, What is IoT? – A Simple Explanation of The Internet of Things.
Visualization, Scoreboards and Shop Floor Analytics
With many IoT solutions comes a lot of data. This data has been great for helping shop floor management, quality personnel and engineering to get immediate and detailed data. What is beginning to become apparent is that subsets of this data can and should be presented to the operators and associates that are often any businesses first line of defense against quality control and ultimately other customer satisfaction issues.
From a quality perspective…
It’s one thing for quality control to notice a trend on an assembly line over the last 30 days that can impact quality but its another thing entirely to setup appropriate thresholds and surface that information directly to the shop floor personnel as a quality issue begins to become apparent. For example, one client had noticed a trend when certain parameters on a machine would “drift” over time. These were not necessarily out of spec just heading that way. They created a threshold that alerted the associates at the assembly line to notify maintenance who could then come and re-calibrate the equipment proactively instead of waiting for the testing equipment further down the assembly process detecting quality issues and the subsequent scramble to find maintenance and deal with scrapped parts. This one change resulted to nearly 80% reduction in downtime related to this specific issue.
From a performance perspective…
We’ve implemented one system that displays a real-time readout of the performance for each particular assembly line. Along with this performance metric is their target performance metric and the delta between the two. That’s pretty basic stuff but where IoT devices come into play is where we are able to gather additional data quickly and easily indicating the likely root causes of performance issues. These include indicators that certain equipment in the assembly process is not being utilized at an appropriate level indicating operators are not moving parts into or out of a particular station quickly enough. Or that a particular assembly station is taking longer than anticipated indicating a maintenance technician may need to be called.
Cheap Sensor Technology
One of the features, if you will, of IoT is that you can quickly and easily deploy a solution with an easy set of tools with a limited and task-driven purpose. Think of a smart thermostat like Google’s Nest. This is an IoT device with a specific purpose that offers a next level type of control and intelligence. But for all those smarts its sensor technology is pretty basic… it’s a glorified thermometer.
While most of the kind of work that we do for our clients is productivity and risk mitigation type of work we do get into cost reduction projects as well. For instance, a Raspberry Pi-based device that has nothing more than a motion sensor that disables and enables a number of different displays and systems. That’s it, it’s a glorified light switch with an estimated 15% electricity reduction to idle assembly cells. Besides our costs our client invested $125 into the Pi and the associated cases, power supplies and sensor.
Task-based Computing
Another growing trend we are seeing is the expansion of more single task-based computing. There are times when a system needs to be implemented that only supports one task or a limited number of tasks. There’s no need for an expensive roll out of desktop computers, monitors, keyboards, mice and the desks/stands to support it all. For quick permanent or temporary implementations a simple interface with an inexpensive display can easily serve a purpose for which a more robust implementation is simply not necessary.
As an example, we’ve used another Raspberry Pi and a touch screen monitor that simply asks shop floor employees going to and from the shop floor to indicate with a couple quick taps areas that need a safety review. The monitor displays a map highlighting the current location, areas around the plant and a few taps later a note has been dropped into a cheap and high-tech suggestion box. On the back-end the safety office can get a heat map of potential issues and quickly review and make adjustments on-the-fly. It took a few hundred dollars in equipment, Wi-Fi and an electrical outlet.
Big Data and Predictive Analytics
As mentioned before all of these cheap and task driven IoT devices can create a massive amount of data that needs to be analyzed to be understood in any meaningful way. We’ve spent the last couple of years working with one client in particular to assist them in implementing a Tableau-based analytics team within their organization. Previously they relied on us to provide them with analytics but we are more expensive than full-time staff and we aren’t necessarily on-site all day every day to be able to answer any and all requests. So we’ve worked with our customer to implement a training and implementation plan so that this more ad hoc reporting can be carried out by their own staff. We simply assist them on more complex reporting and analytics.
